
Colin McGinn
Project Developer of CensusTracker
Colin McGinn is an undergraduate at Harvard University, currently concentrating in Government with a secondary in Computer Science.
CensusTracker
The 2020 Census is incredibly vital to the future of American democracy. The Decennial Census is the basis for which seats in the U.S. House of Representatives are decided and how billions of dollars of the federal budget are allocated. Artificially low or high numbers of responses relative to the actual population can result in states gaining or losing representation in a core element of American democracy and communities not receiving the vital resources they need. Given the significant disruption to American society from COVID-19, there are new concerns this year that this disruption will affect the count of the 2020 Census. Thus, the CensusTracker team has developed a dynamic map displaying the 2020 Census self-response rates, both in absolute terms and relative to the self-response rates of the 2010 Census. These tools are designed to be used by policy makers, advocacy groups, journalists, and other stakeholders to monitor, observe, and analyze the ongoing response rates of the 2020 Census in every community across America. (Note: Response rates displayed are self response rates, which differ slightly from total response rates. Total response rates are published at the state level only, and can be accessed here)
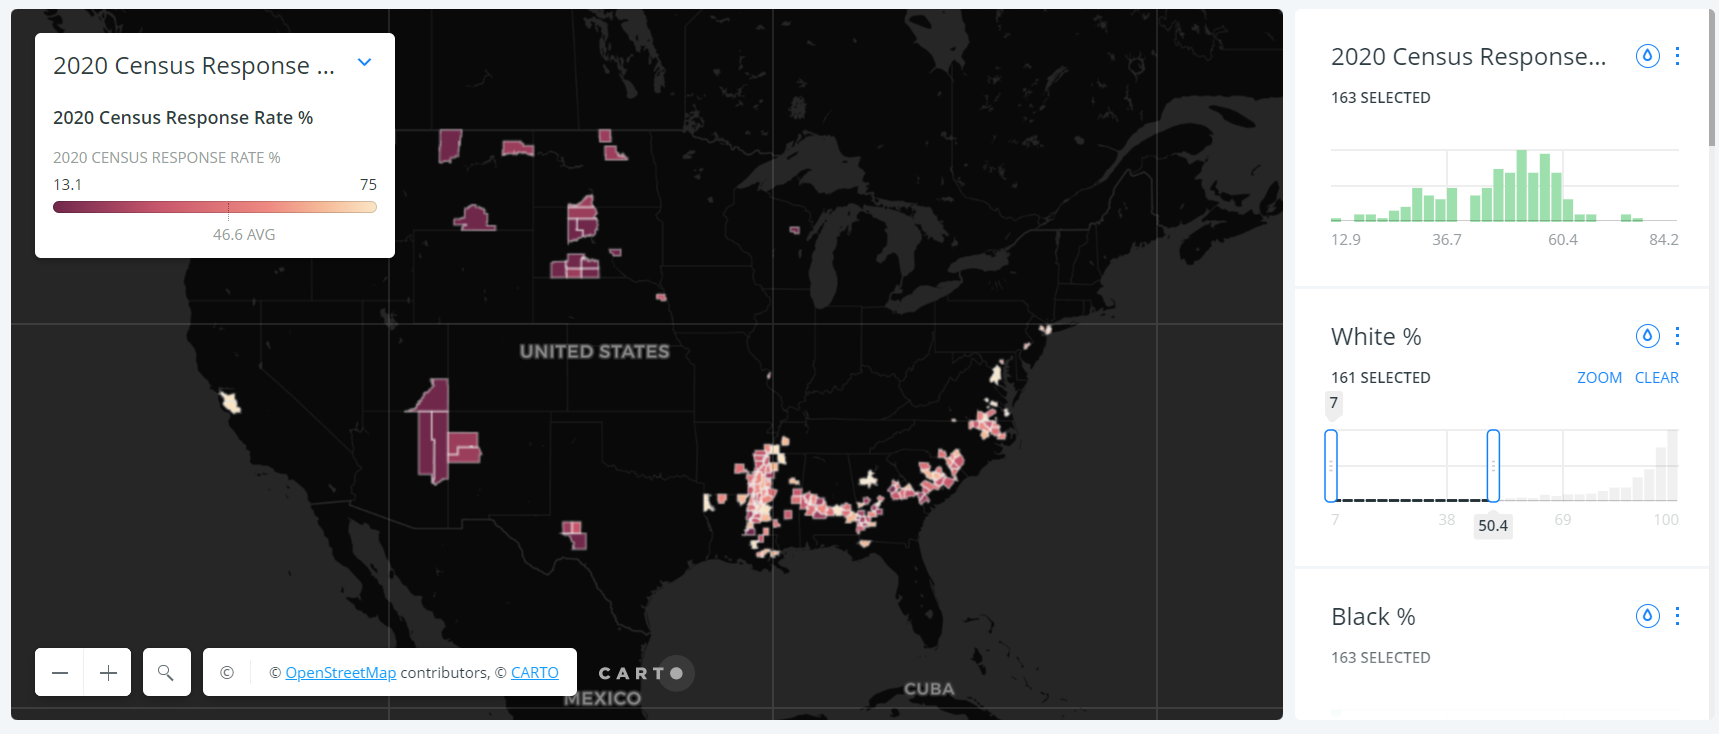
The CensusTracker maps have three major methods of interaction:
Please note that the CensusTracker is using current 2020 Census self-response data which is available at the county-level at https://www2.census.gov/programs-surveys/decennial/2020/data/2020map/2020/ This is lower than the Enumeration rate which includes follow-up by census takers to non-response households and is available at the state-level at https://2020census.gov/en/response-rates/nrfu.html
2020 Census self-response rate data as of 8/28/2020.
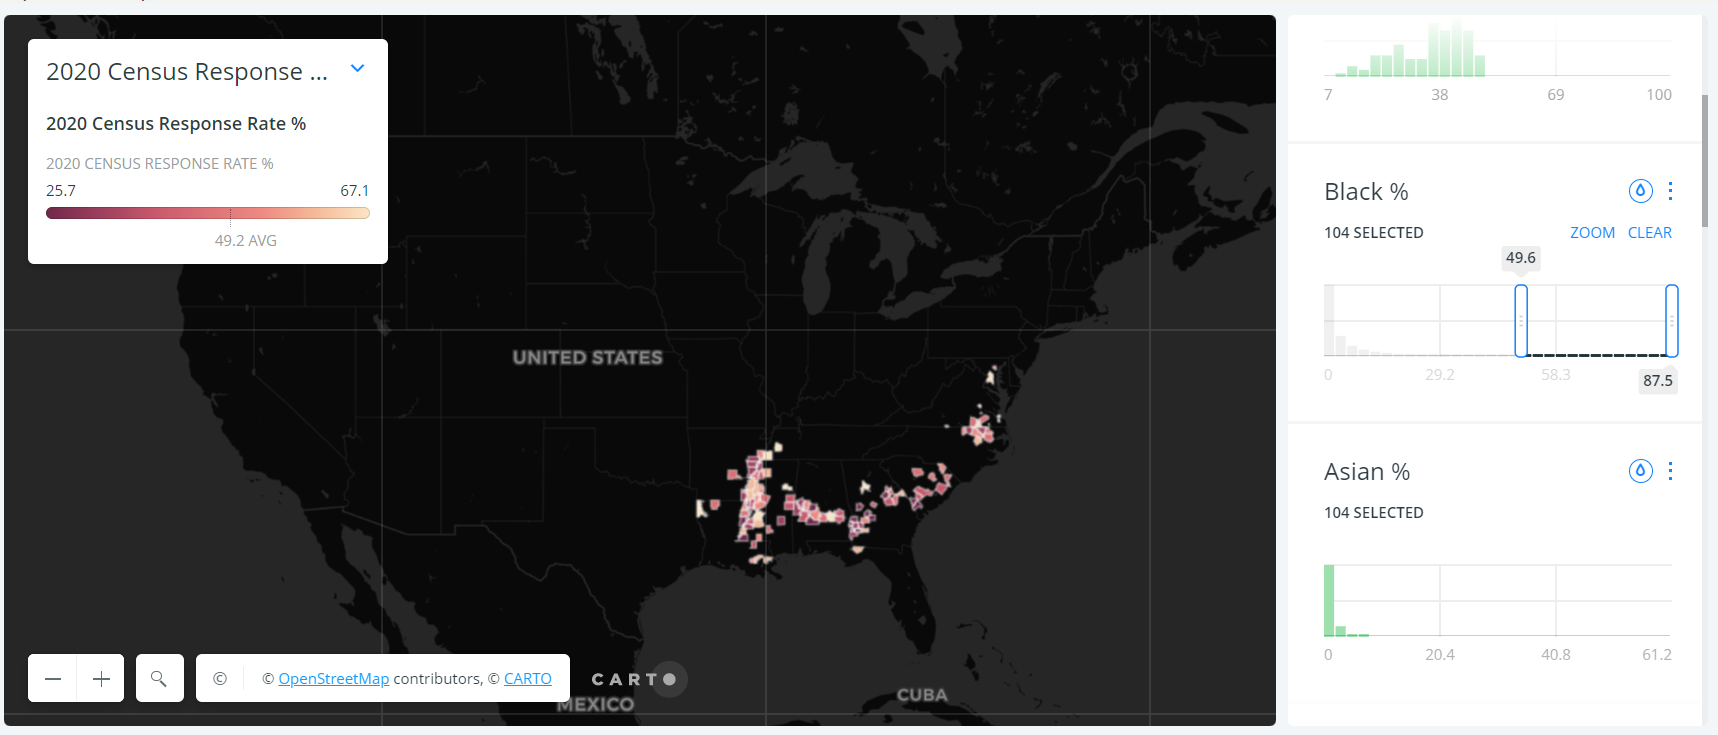
Example 1: Counties with majority Black respondents
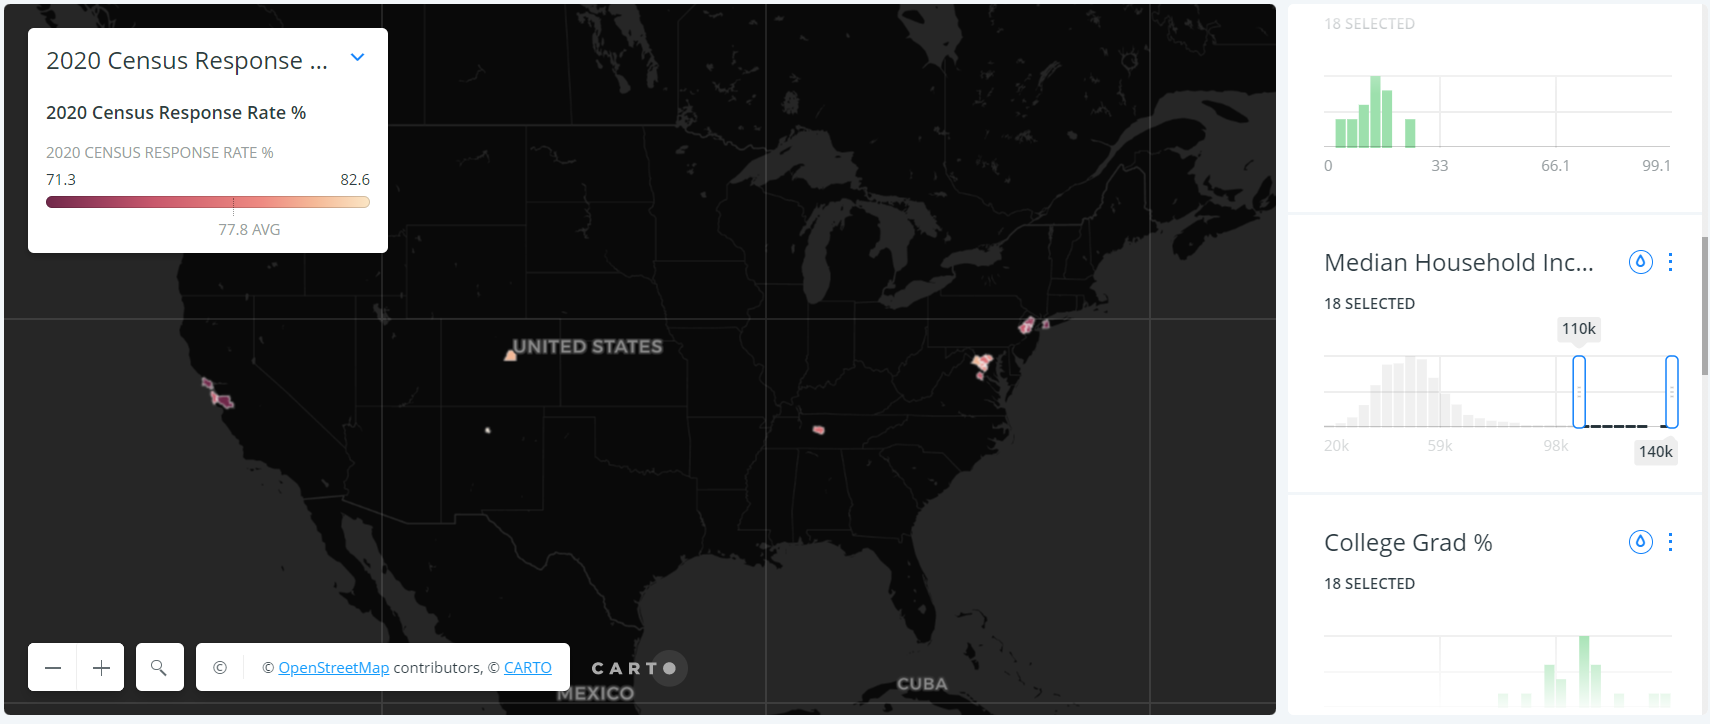
Example 2: Counties where median household income is over $110k
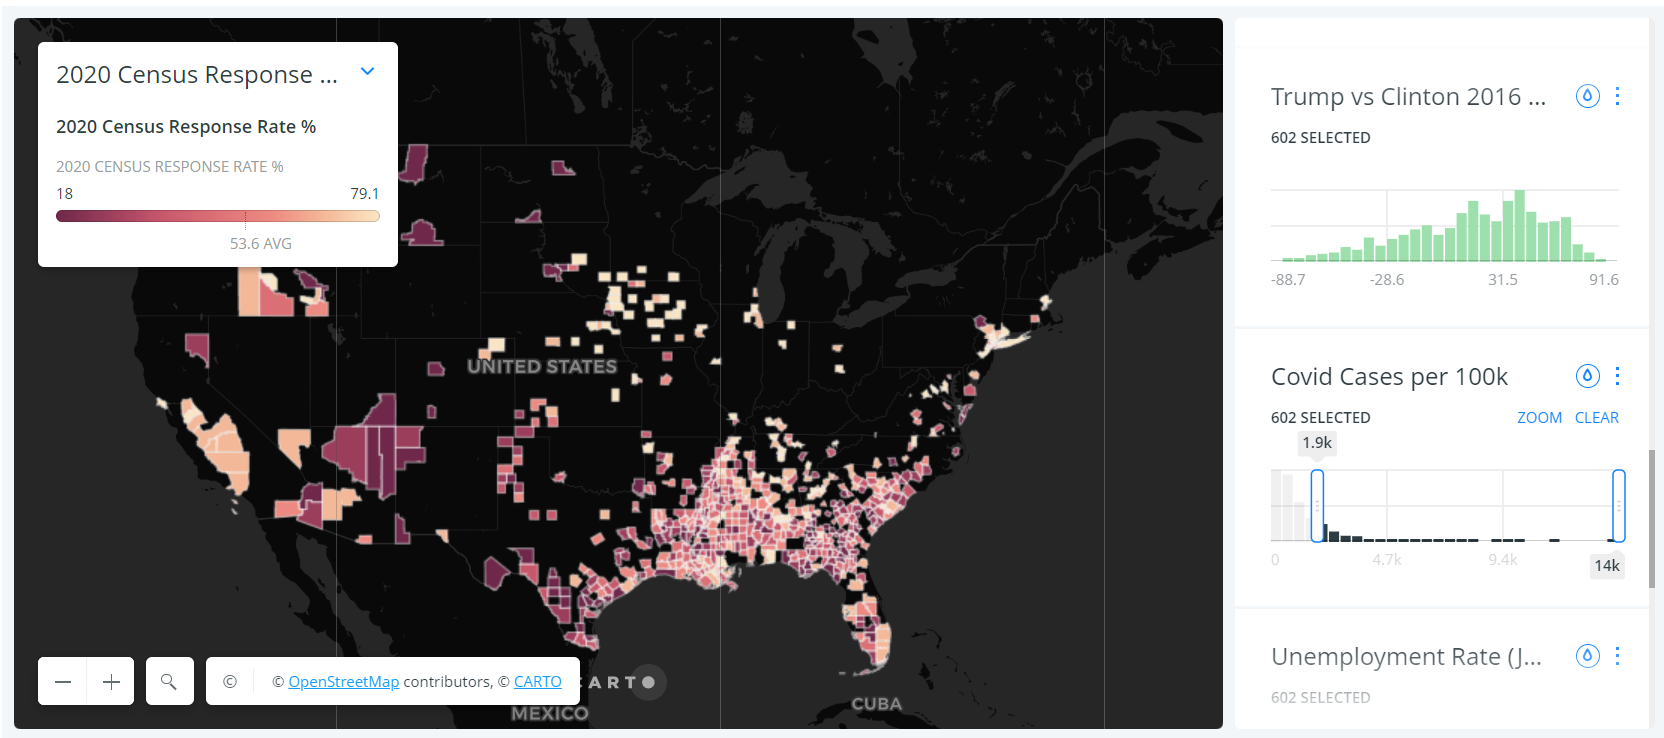
Example 3: Counties with Over 1.9k COVID cases per 100k
2020 Census self-response rate data as of 8/28/2020.
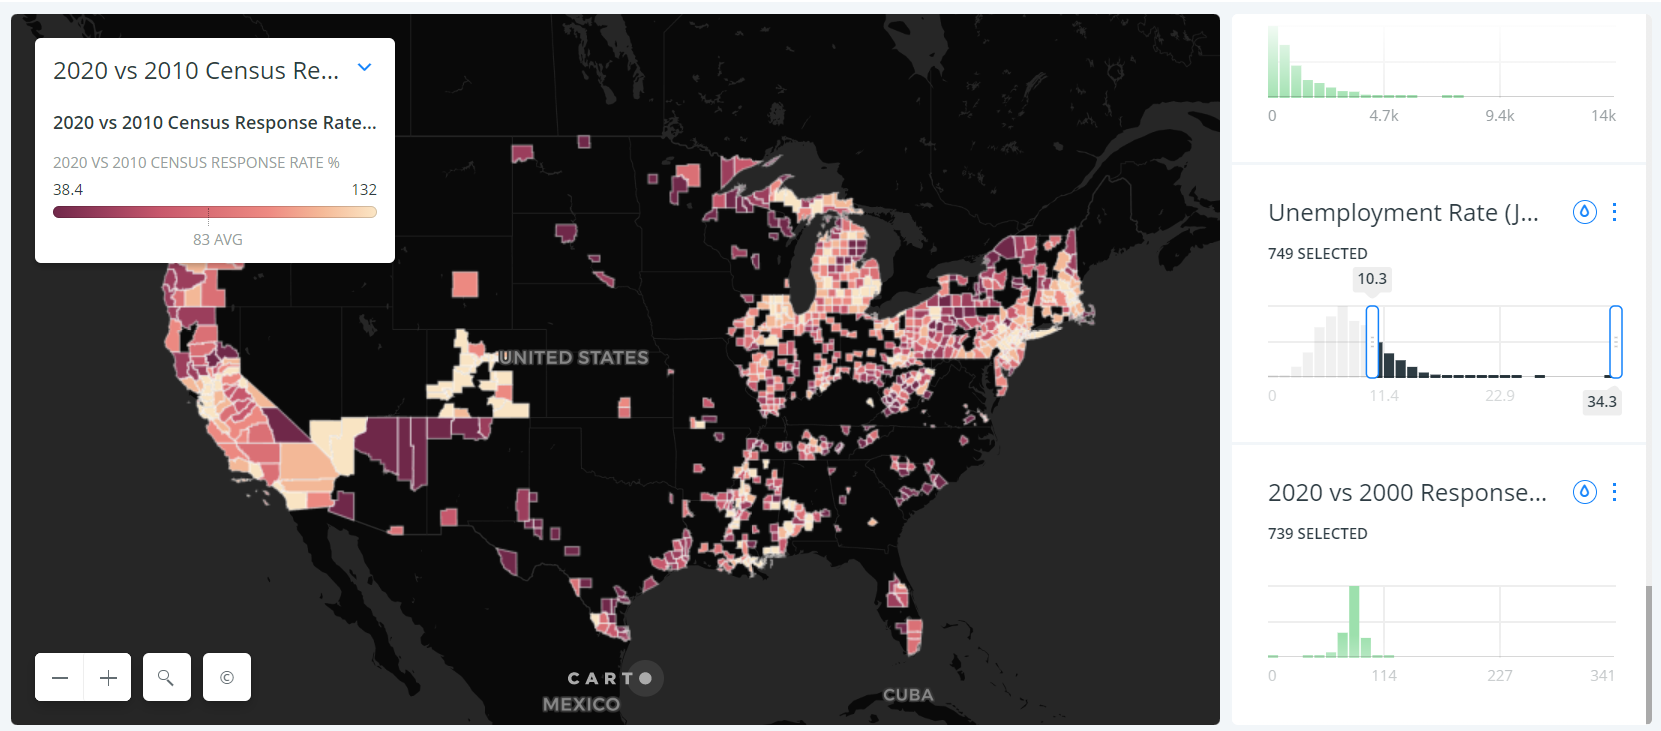
Ratio of 2020 / 2010 Response Rate, where 100 means that 2020 = 2010 response rate for that county.
Example 1: Counties with Unemployment Over 10.3%
Example 2: Counties where the majority of respondents were nonwhite
Who are we?
Colin McGinn
Project Developer of CensusTracker
Colin McGinn is an undergraduate at Harvard University, currently concentrating in Government with a secondary in Computer Science.

Jinyan Zang
Project Manager of CensusTracker
Research and Project Manager of the Public Interest Tech Lab
Jinyan Zang is a PhD Candidate in Government at Harvard University and a 2017 recipient of the Paul and Daisy Soros Fellowships for New Americans. He is the Managing Editor of the Journal of Technology Science. He is an experienced researcher on consumer protection, data and election security, and privacy issues as a Research Fellow at the Federal Trade Commission and a Research Analyst at Harvard University’s Data Privacy Lab and at the Institute for Quantitative Social Science. He graduated cum laude in 2013 from Harvard College with a B.A. in Economics.

Prof. Latanya Sweeney
Faculty Director of the Public Interest Tech Lab
As Professor of the Practice of Government and Technology at the Harvard Kennedy School and in the Harvard Faculty of Arts and Sciences, Department of Government, my mission is create and use technology to assess and solve societal, political and governance problems, and to teach others how to do the same. The scientific study of technology's impact on humankind, is termed technology science and I am the founding Editor-in-Chief of the Journal of Technology Science.